Understanding Analytics
- Introduction
- Analytics Dashboard Overview
- Member Analytics
- Content Analytics
- Group Analytics
- Event Analytics
- Using Data for Decision Making
- Best Practices
- Next Steps
Introduction
Analytics provide valuable insights into your community's health, growth, and engagement patterns. By understanding these metrics, you can make informed decisions about community management, content strategy, and growth initiatives. This tutorial will guide you through the analytics tools available on Gush and how to use them effectively.
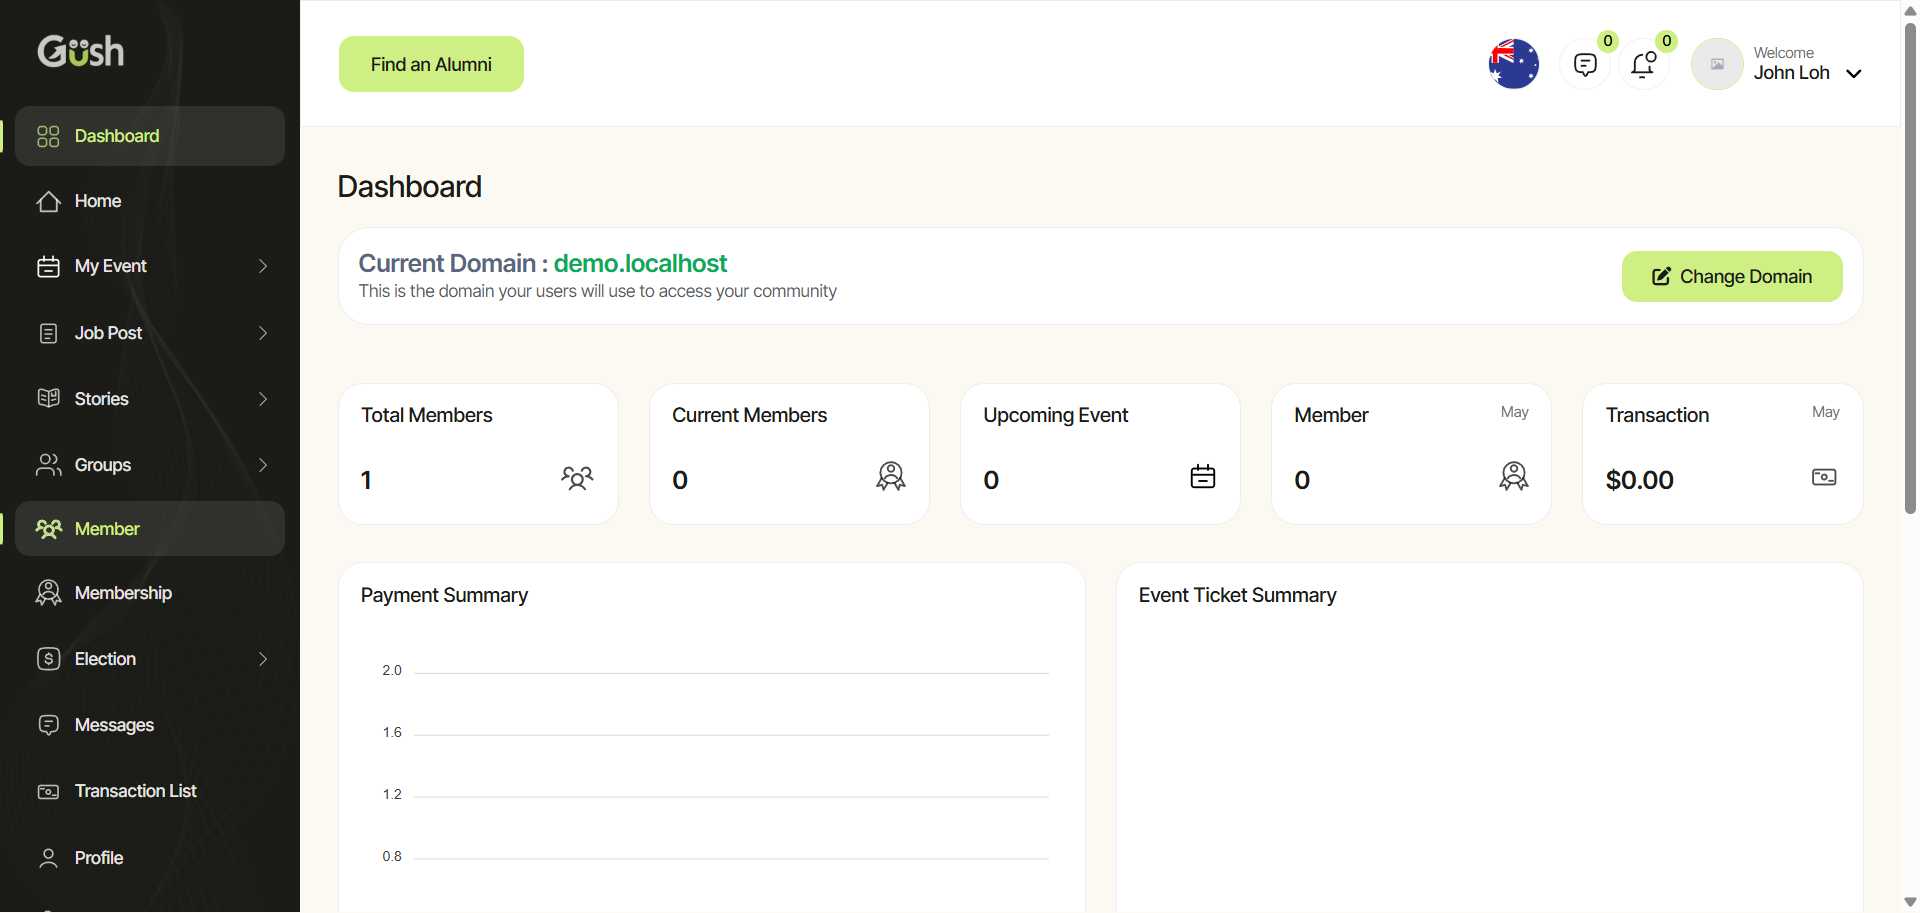
Analytics Dashboard Overview
The Analytics Dashboard provides a comprehensive view of your community's performance:
- Access the Analytics Dashboard:
- From your Admin Dashboard, navigate to the Dashboard section
- You'll see an overview of key metrics at the top
-
Dashboard components:
- Summary Cards: Quick view of essential metrics
- Time Period Selector: Adjust the date range for your analysis
- Trend Graphs: Visual representation of metrics over time
- Category Tabs: Navigate between different analytics categories
-
Key metrics on the main dashboard:
- Active Members: Daily, weekly, and monthly active users
- Growth Rate: New member acquisition trends
- Engagement Rate: Percentage of members who are active
- Content Creation: Posts, comments, and other contributions
- Retention: How many members return regularly
Pro Tip: Check your analytics dashboard weekly to spot trends early and respond proactively to changes in community activity.
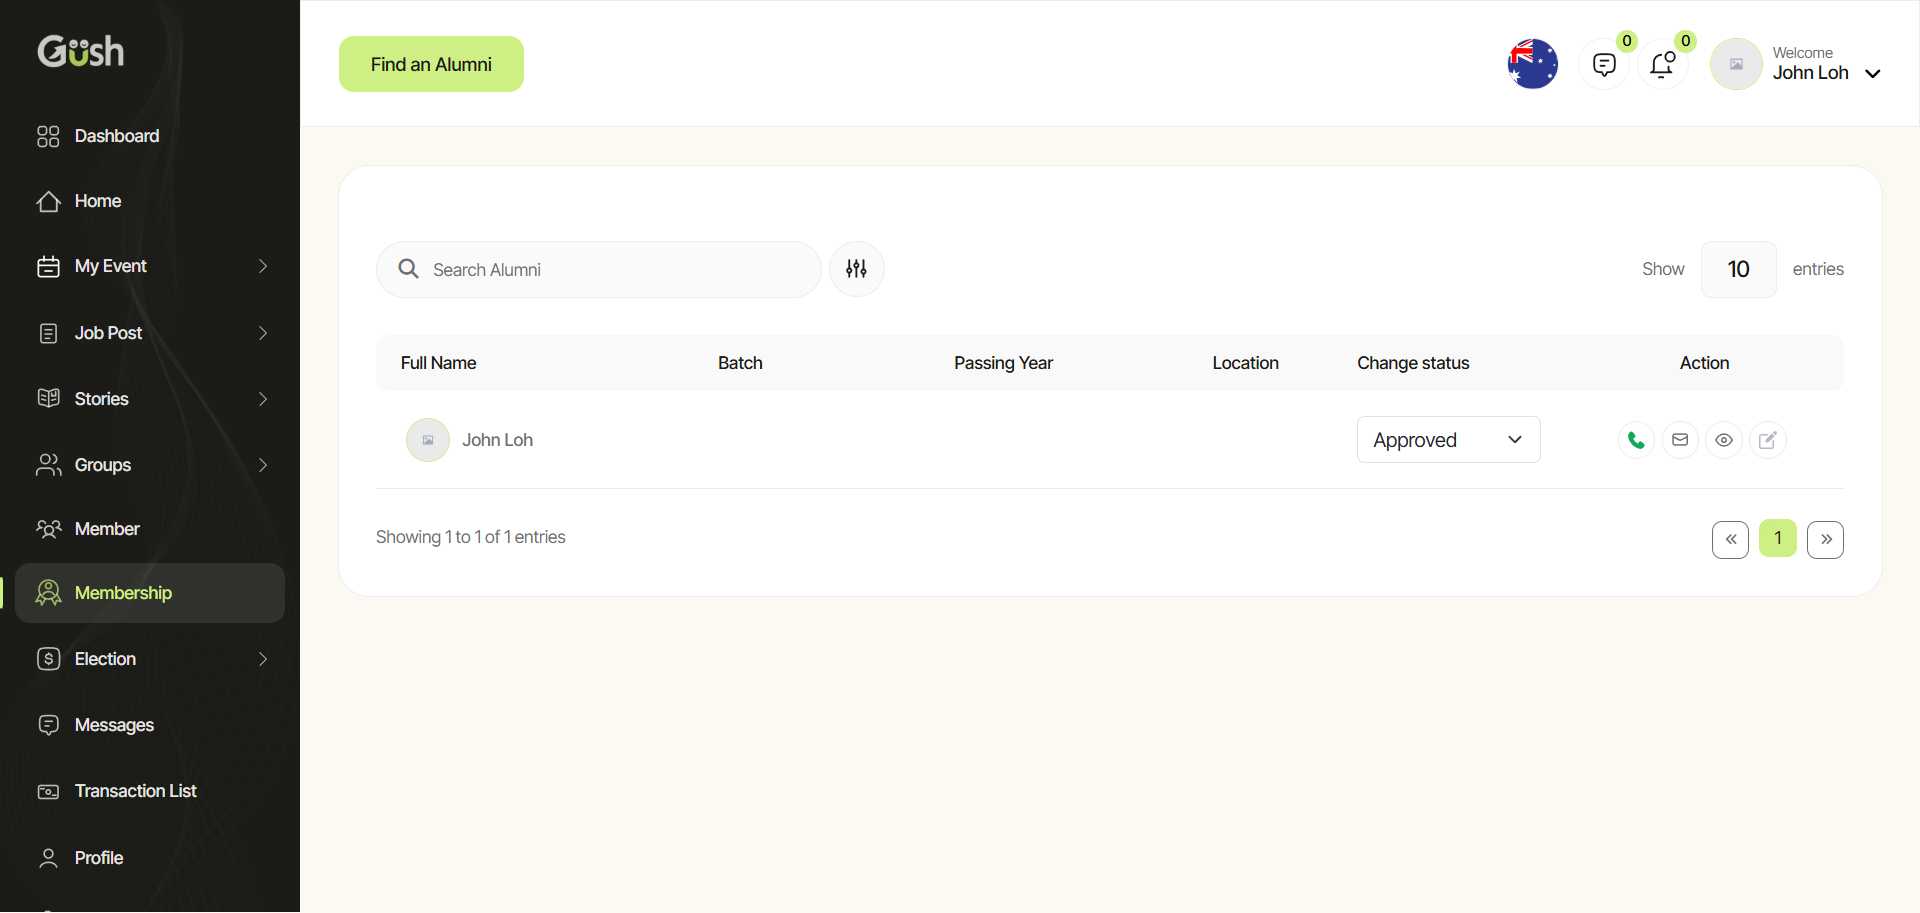
Member Analytics
Understand your community's membership patterns:
- Navigate to Manage Members > All List to view and manage your members
-
Analyze membership growth:
- New member signups over time
- Membership growth rate
- Referral sources (how members found your community)
-
Examine member activity:
- Active vs. inactive members
- Activity frequency distribution
- Peak activity times and days
- Member journey progression
-
Understand member demographics (if collected):
- Age distribution
- Geographic location
- Professional background
- Interests and expertise
-
Identify key members:
- Most active contributors
- Influential members (whose content gets high engagement)
- Potential community leaders
- At-risk members (showing declining activity)
Pro Tip: Create member segments based on activity levels to develop targeted engagement strategies for each group.
Content Analytics
Gain insights into what content resonates with your community:
-
Navigate to the Content Analytics section
-
Analyze content performance:
- Most viewed content
- Highest engagement (comments, reactions)
- Content with longest time spent
- Sharing frequency
-
Examine content creation patterns:
- Content creation over time
- Distribution of content types (posts, questions, events, etc.)
- Creator diversity (how many different members create content)
- Admin vs. member-generated content ratio
-
Understand content topics:
- Popular topics and themes
- Trending keywords
- Underserved topics with high engagement
- Topic evolution over time
-
Content lifecycle analysis:
- How long content remains active
- Patterns in when content receives engagement
- Resurrection of older content
- Seasonal trends in content themes
Pro Tip: Use content analytics to identify your community's "greatest hits" and create similar content or repurpose successful formats.
Group Analytics
Evaluate the performance of different groups within your community:
-
Navigate to the Group Analytics section
-
Analyze group activity:
- Most active groups
- Fastest growing groups
- Groups with highest member retention
- Groups with declining activity
-
Examine group content:
- Content creation by group
- Engagement rates within groups
- Content types that perform best in each group
- Cross-posting between groups
-
Understand group membership:
- Member overlap between groups
- Single-group vs. multi-group members
- Group joining patterns
- Group leaving patterns
-
Group comparison:
- Side-by-side metrics for different groups
- Relative performance over time
- Identifying successful group management practices
Pro Tip: Use group analytics to identify which types of groups resonate most with your community, and consider creating more groups with similar characteristics.
Event Analytics
Measure the success of your community events:
-
Navigate to the Event Analytics section
-
Analyze event participation:
- Registration numbers
- Attendance rates
- Participation patterns
- Repeat attendees
-
Examine event engagement:
- In-event activity (comments, reactions)
- Post-event discussions
- Content created from events
- Follow-up actions taken
-
Understand event preferences:
- Most popular event types
- Optimal event timing
- Topic preferences
- Format preferences (webinar, discussion, workshop, etc.)
-
Event impact analysis:
- Effect on overall community engagement
- Member acquisition through events
- Relationship between event participation and retention
- Long-term impact of regular events
Pro Tip: Compare metrics for different event formats to determine which types of events drive the most engagement in your community.
Using Data for Decision Making
Transform analytics insights into actionable strategies:
-
Identify opportunities:
- Content gaps to fill
- Underserved member segments
- Potential new groups or features
- Optimal times for key activities
-
Address challenges:
- Declining engagement areas
- Underperforming content types
- Member segments at risk of churning
- Barriers to participation
-
Optimize resource allocation:
- Focus on high-impact activities
- Sunset underperforming initiatives
- Prioritize features based on usage data
- Target efforts to peak activity times
-
Set data-informed goals:
- Establish realistic growth targets
- Create engagement benchmarks
- Develop content performance standards
- Define success metrics for initiatives
Pro Tip: Create a regular analytics review process with your moderation team to ensure insights are translated into action.
Best Practices
Based on successful Gush communities, here are some best practices for using analytics:
- Establish baselines before making significant changes
- Look for trends rather than reacting to daily fluctuations
- Combine quantitative data with qualitative feedback
- Focus on actionable metrics that can inform decisions
- Consider context when interpreting data (seasons, external events)
- Share relevant insights with your community when appropriate
- Test hypotheses with small experiments before major changes
- Track the impact of changes you make
- Balance data-driven decisions with community values and purpose
- Respect privacy in how you collect and use analytics data
Next Steps
Now that you understand how to use analytics, you're ready to:
- Grow Your Community - Apply analytics insights to targeted growth strategies
- Explore Monetization Options - Use data to identify potential revenue opportunities
Remember, analytics are most valuable when they lead to action. Regularly review your community data, identify patterns and opportunities, and implement changes based on what you learn.